SaaS Growth Strategy · Customer Retention · CAC Optimization
Article at a Glance
- Understanding the churn rate CAC relationship is critical: a 20% annual churn rate forces companies to dedicate substantial customer acquisition resources to replacing lost customers instead of expanding their customer base
- High churn creates a hidden CAC multiplier effect where acquisition costs are 5-25 times higher than retention expenses
- Customer lifetime value significantly decreases when churn shortens the average customer lifespan and extends CAC payback periods
- Even a modest 5% improvement in retention can boost profits by 25-95%, making it one of the most effective growth strategies
- Net revenue retention below 100% serves as a warning sign of poor product-market fit and growth stagnation
Table of Contents
- Understanding Churn Rate CAC: 20% Churn Means 1-in-5 Customers Leave Annually
- The Hidden Churn Rate CAC Multiplier Effect
- Customer Lifetime Value Takes the Hit
- Growth Stagnation vs Revenue Expansion
- 5% Retention Increase Delivers 25-95% Profit Boost
- How Media Strobe Can Help
- Frequently Asked Questions
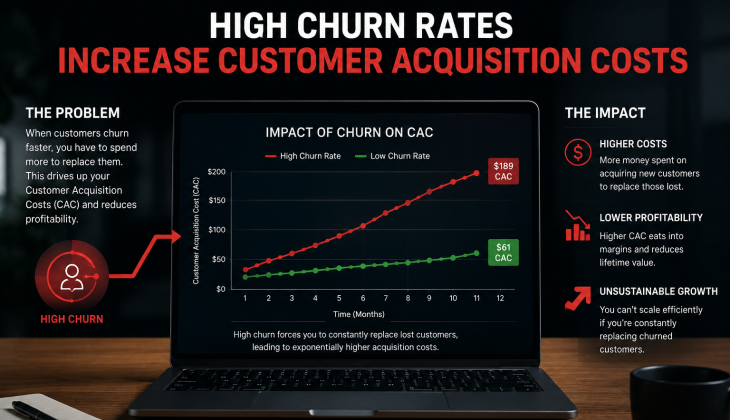
For SaaS businesses and growth strategists, understanding the churn rate CAC relationship reveals a critical growth barrier that many companies overlook. When churn rate CAC dynamics are ignored, companies face exponentially rising customer acquisition costs. When one in five customers leaves annually, the mathematics of sustainable growth become severely compromised.
Understanding Churn Rate CAC: 20% Churn Means 1-in-5 Customers Leave Annually
A 20% annual churn rate signifies that one in five customers will leave a business over a year, creating a substantial drag on growth momentum. This figure represents a high rate for established SaaS businesses where good annual churn rates typically fall below 5%, though it can be within the normal range for small and medium-sized businesses or B2C SaaS. Small and medium-sized businesses often experience annual churn rates between 10% and 20% due to factors like shorter contract terms and price sensitivity, making this scenario unfortunately common.
The immediate impact becomes clear when visualizing customer flow: for every 100 customers acquired, 20 will churn within twelve months. This creates a constant requirement to replace lost revenue before any net growth can occur. Companies implementing multichannel retention strategies through various touchpoints have demonstrated significant improvements in customer lifetime value and reduced acquisition dependency.
High churn rates serve as a critical indicator of potential underlying issues such as customer dissatisfaction, poor product-market fit, or intense market competition. The 20% threshold often signals that fundamental business model adjustments are necessary rather than simply increasing acquisition spend.
The 20% Churn Impact Visualization
Starting Customer Base: 1,000 customers
Annual Churn at 20%: 200 customers leave
Revenue Impact: Must replace 200 customers before achieving any net growth
Growth Reality: To achieve 20% net growth, must acquire enough customers for 40% gross growth
Every 5 new customers acquired = 1 filling a churn gap rather than contributing to expansion
The Hidden Churn Rate CAC Multiplier Effect
How Churn Rate CAC Creates Compounding Losses
High churn rates create a compounding effect on customer acquisition costs that extends far beyond the initial investment required to gain new customers. This hidden multiplier transforms what appears to be a marketing efficiency problem into a fundamental business sustainability challenge.
1. Replacement Costs Before Growth Investment
When 20% of customers churn annually, companies must allocate significant resources toward replacing lost customers before any actual growth can occur. Understanding the churn rate CAC dynamics reveals how this replacement-first approach diverts funds that could otherwise fuel expansion initiatives, new product development, or market penetration strategies. The mathematical reality means that for every five new customers acquired, one is simply filling a gap left by churned customers rather than contributing to net growth.
This dynamic creates a treadmill effect where acquisition teams work harder but the business moves forward more slowly. Marketing budgets become split between defensive spending (replacement) and offensive spending (growth), reducing the overall efficiency of customer acquisition investments. For strategies on building sustainable authority that reduces acquisition dependency, many companies are exploring content-driven approaches.
2. 5-25x Higher Acquisition vs Retention Expenses
Research consistently demonstrates that acquiring a new customer costs 5 to 25 times more than retaining an existing one. This disparity becomes particularly problematic when high churn rates force companies to continuously prioritize expensive acquisition over cost-effective retention. The financial implication is that every churned customer represents not just lost revenue, but also the opportunity cost of deploying acquisition resources more efficiently.
The multiplier effect intensifies when considering that retained customers typically increase their spending over time, while new customers require additional onboarding costs and time to reach full value realization. This creates a scenario where companies pay premium prices for customers who may not even reach the profitability threshold before churning again.
| Activity | Relative Cost | Impact at 20% Churn |
|---|---|---|
| New Customer Acquisition | 5-25x baseline | Must acquire 125 to replace 100 churned |
| Customer Retention Programs | 1x baseline | Prevents churn, enables net growth |
| Onboarding Investment | Additional cost per new customer | Repeated for replacement customers |
| Time to Value Realization | Delayed revenue recognition | Extended across churned customer base |
Customer Lifetime Value Takes the Hit
High churn rates directly assault customer lifetime value by fundamentally altering the economics of customer relationships. The churn rate CAC connection becomes particularly damaging when shortened customer lifespans reduce the total revenue opportunity from each acquisition investment, creating a cascading effect on business profitability.
Shortened Customer Lifespan Reduces Total Revenue
When customers churn at a 20% annual rate, the average customer lifespan drops to approximately five years, assuming a linear churn pattern. This shortened timeline dramatically reduces the total revenue potential from each customer relationship. In subscription businesses, this means fewer billing cycles, reduced upselling opportunities, and diminished referral potential.
The revenue impact compounds because customer relationships typically become more profitable over time as onboarding costs are amortized and customers expand their usage or upgrade their plans. High churn prevents companies from reaching these more profitable relationship phases, keeping average revenue per customer artificially low.
Extended CAC Payback Period Risk
The customer acquisition cost payback period, which indicates the time required to recoup the cost of acquiring a customer, extends significantly under high churn conditions. When customers leave before their acquisition costs are fully recovered, companies face direct financial losses on those customers. This creates a dangerous scenario where acquisition investments never reach breakeven, let alone profitability.
Extended payback periods also strain cash flow and reduce the speed at which companies can reinvest acquisition profits into further growth. The longer payback cycle means fewer resources available for immediate reinvestment, slowing the overall growth engine.
Example: How 200 Lost Customers Cost $2M
Consider a SaaS company with an annual contract value of $10,000 per customer. With a 20% churn rate affecting a customer base of 1,000 customers, 200 customers will leave annually. This represents a direct revenue loss of $2 million per year that must be replaced before any net growth can occur.
The actual cost extends beyond the lost revenue. If the company’s customer acquisition cost is $2,000 per customer, replacing these 200 churned customers requires an additional $400,000 in acquisition spending. Combined with the lost revenue opportunity, the total impact reaches $2.4 million annually. This figure doesn’t account for the lost expansion revenue these customers might have generated, referrals they could have provided, or the reduced efficiency of spreading fixed costs across fewer customers.
For a company targeting 20% annual growth, this churn impact means they must actually acquire enough new customers to achieve 40% gross growth just to net their desired 20% increase. This mathematical reality explains why many companies struggle to achieve their growth targets despite significant acquisition investments.
The True Cost of 200 Churned Customers
Base Scenario:
- Customer Base: 1,000 customers
- Annual Contract Value: $10,000 per customer
- Churn Rate: 20% annually
- CAC: $2,000 per customer
Annual Impact Breakdown:
- Direct Revenue Loss: $2,000,000 (200 customers × $10,000)
- Replacement CAC: $400,000 (200 customers × $2,000)
- Total Annual Impact: $2,400,000
- Lost Expansion Revenue: Not calculated (additional loss)
- Lost Referral Value: Not calculated (additional loss)
To achieve 20% net growth, must acquire customers for 40% gross growth
Growth Stagnation vs Revenue Expansion
High churn rates create a fundamental barrier between companies that achieve sustainable growth and those trapped in stagnation cycles. The churn rate CAC relationship often determines whether businesses can generate net revenue expansion from their existing customer base or remain dependent on expensive new customer acquisition for all growth.
Net Revenue Retention Below 100%
Companies with net revenue retention below 100% find themselves entirely dependent on new sales for growth. This means the revenue lost to churn exceeds any expansion revenue generated from existing customers through upsells, cross-sells, or usage growth. Such companies become trapped in a cycle where all growth must come from new customer acquisition, making them vulnerable to market changes and increasing acquisition costs.
Net revenue retention below 100% also signals that existing customers are not finding increasing value in the product or service over time. This lack of expansion indicates potential product-market fit issues or insufficient customer success programs, both of which contribute to higher churn rates and reduced customer lifetime value. For insights on sustainable growth strategies, many companies are exploring multi-channel approaches.
Warning Signs of Poor Product-Market Fit
Persistent 20% churn rates often indicate underlying product-market fit problems that no amount of acquisition spending can solve. When customers consistently leave at high rates, it suggests the product doesn’t deliver sufficient value to justify continued investment from the customer perspective. This creates a vicious cycle where poor retention leads to higher acquisition costs, which in turn pressures companies to accept lower-quality customers, further increasing churn.
The warning signs extend beyond churn metrics to include low customer satisfaction scores, frequent support tickets, delayed time to value realization, and minimal customer advocacy. Companies experiencing these symptoms need to address fundamental product and service issues before increasing acquisition investments.
Warning Signs of Poor Product-Market Fit
- Persistent 20%+ annual churn rate despite retention efforts
- Net revenue retention below 100% (no expansion revenue)
- Low customer satisfaction scores across customer base
- High frequency of support tickets indicating confusion or frustration
- Delayed time to value realization extending beyond expected timelines
- Minimal customer advocacy or referral activity
- Customers downgrading rather than upgrading plans
- Shortened customer lifecycles compared to industry benchmarks
These symptoms require addressing fundamental product and service issues before increasing acquisition spend
| Net Revenue Retention Level | What It Means | Growth Dependency |
|---|---|---|
| Below 100% | Lost revenue exceeds expansion | 100% dependent on new sales for growth |
| 100% | Churn balanced by expansion | All new sales contribute to net growth |
| 100-120% | Moderate expansion revenue | Strong foundation with new sales multiplier |
| 120%+ | Strong expansion revenue | Growth possible without new acquisition |
5% Retention Increase Delivers 25-95% Profit Boost
Research consistently demonstrates that even modest improvements in customer retention generate disproportionate profit increases. A mere 5% increase in customer retention can boost profits by 25% to 95%, making retention optimization one of the highest-leverage activities for SaaS businesses and growth strategists seeking to optimize their churn rate CAC dynamics.
This profit multiplication occurs because retained customers generate revenue without additional acquisition costs, expand their spending over time, and often become advocates who drive referral business. The compounding effect means that retention improvements create accelerating returns rather than linear benefits. For a company with 20% churn, reducing it to 15% doesn’t just save 5% of customers—it fundamentally changes the economics of the entire business model and improves churn rate CAC efficiency dramatically.
The focus should concentrate on the first 90 days of the customer lifecycle, where a significant portion of churn occurs, with some research indicating that 70% of churn happens in the first 3 months. Building an onboarding flow that delivers first value within the first week, combined with proactive outreach to customers showing early disengagement warning signs, can prevent significant customer losses. A dedicated customer success function that prevents just five churns per month at a $10,000 annual contract value saves $600,000 per year—far exceeding the cost of most retention programs.
For SaaS companies looking to optimize their customer acquisition strategy while building sustainable growth foundations, Media Strobe provides digital marketing solutions that balance acquisition efficiency with retention optimization. Understanding how different channels perform for both acquisition and retention is critical, as explored in this channel comparison analysis.
The 5% Retention Improvement Impact
Research Finding: 5% retention increase = 25-95% profit boost
Why This Works:
- Retained customers generate revenue without acquisition costs
- Customer spending typically expands over time (upsells, cross-sells)
- Advocacy and referral business from satisfied customers
- Compounding effect creates accelerating returns
Example Calculation:
Company with 20% churn reducing to 15%:
- Saves 5% of customer base annually
- Fundamentally changes business model economics
- Shifts budget from replacement to growth
- Enables faster reinvestment cycle
Critical First 90 Days: Where 70% of Churn Happens
Key Stat: 70% of churn occurs in the first 3 months of customer lifecycle
Retention Strategy Focus Areas:
- Week 1: Deliver first value quickly (time-to-value optimization)
- Days 1-30: Proactive onboarding with clear milestones
- Days 31-60: Monitor engagement signals and intervene early
- Days 61-90: Identify expansion opportunities and solidify value
ROI Example:
Preventing 5 churns per month at $10,000 ACV = $600,000 annual savings
This typically exceeds the cost of dedicated customer success programs
How Media Strobe Can Help
Reduce Customer Acquisition Costs Through Strategic Content Distribution
High churn rates create a hidden multiplier effect on customer acquisition costs, but the solution isn’t always to spend more on acquisition. Media Strobe’s MultiCast campaigns help SaaS companies attract better-fit customers who are more likely to stay, fundamentally changing the economics of customer acquisition and retention.
By answering the specific questions your ideal customer profile asks before making purchase decisions, MultiCast campaigns attract qualified prospects who understand your value proposition from the start. This means lower acquisition costs, faster time-to-value, and improved retention rates—directly addressing the churn-CAC relationship explored in this article.
What MultiCast campaigns deliver for customer acquisition optimization:
- Better-qualified prospects who understand your solution (reduces early-stage churn)
- Multichannel presence that builds authority before first contact
- Educational content that pre-qualifies leads and sets expectations
- Reduced customer acquisition costs through improved targeting efficiency
- Higher-quality customers with longer expected lifespans
- Sustainable growth foundation that compounds over time
Learn how MultiCast campaigns reduce CAC while improving retention
Frequently Asked Questions
What is a good churn rate for SaaS companies?
Good annual churn rates for established SaaS businesses typically fall below 5%. However, acceptable churn varies by business model: small and medium-sized businesses often experience 10-20% annual churn due to shorter contract terms and price sensitivity, while enterprise SaaS companies should target churn rates below 5% annually. B2C SaaS products generally have higher acceptable churn rates than B2B products. The key is understanding whether your churn rate allows for sustainable growth given your customer acquisition costs and customer lifetime value targets.
How does churn rate affect customer acquisition cost?
Churn rate creates a hidden multiplier effect on customer acquisition costs in several ways. The churn rate CAC relationship reveals that companies must replace churned customers before achieving any net growth, splitting acquisition budgets between replacement (defensive) and expansion (offensive) spending. Acquiring new customers costs 5-25 times more than retaining existing ones, making high churn rates exponentially more expensive. When customers churn before acquisition costs are recovered, companies face direct losses on those acquisition investments. A 20% churn rate means 20% of acquisition spending simply replaces lost customers rather than driving growth. Understanding churn rate CAC dynamics is essential for sustainable SaaS growth.
What is the relationship between churn and customer lifetime value?
Churn rate directly determines customer lifetime value by defining how long customers remain with your business. A 20% annual churn rate translates to an average customer lifespan of approximately five years, limiting the total revenue opportunity from each customer. High churn also extends the CAC payback period—the time required to recoup acquisition costs—potentially preventing companies from ever reaching profitability on churned customers. Additionally, churned customers never reach the more profitable later stages of customer relationships where expansion revenue and referrals typically occur, further reducing lifetime value.
How much can retention improvements boost profits?
Research consistently shows that even modest retention improvements generate disproportionate profit increases. A 5% increase in customer retention can boost profits by 25% to 95%. This multiplication occurs because retained customers generate revenue without additional acquisition costs, typically increase their spending over time through upsells and cross-sells, and often become advocates driving referral business. For a company with 20% churn, reducing it to 15% doesn’t just save 5% of customers—it fundamentally changes business model economics by shifting resources from replacement to growth investments.
What is net revenue retention and why does it matter?
Net revenue retention measures whether revenue from existing customers grows or shrinks over time, accounting for both churn and expansion revenue. Companies with net revenue retention below 100% lose more revenue to churn than they gain from upsells and cross-sells, making them entirely dependent on new customer acquisition for growth. This creates severe churn rate CAC pressure as all growth must come from expensive new customer acquisition. Net revenue retention above 100% indicates the business can grow even without acquiring new customers, as expansion revenue from existing customers exceeds churn losses. This metric serves as a critical indicator of product-market fit, customer success program effectiveness, and sustainable growth potential.
When does churn indicate poor product-market fit?
Persistent 20%+ annual churn rates despite retention efforts typically signal underlying product-market fit problems. Additional warning signs include net revenue retention below 100%, low customer satisfaction scores, high support ticket frequency, delayed time to value realization, minimal customer advocacy or referrals, and customers downgrading rather than upgrading. When these symptoms appear together, they indicate the product doesn’t deliver sufficient value to justify continued customer investment. Addressing these fundamental issues requires product and service improvements rather than increased acquisition spending.
Where should companies focus retention efforts?
The first 90 days of the customer lifecycle deserve intense focus, as research indicates 70% of churn happens in the first three months. Priority actions include delivering first value within the first week, implementing proactive onboarding with clear milestones, monitoring engagement signals for early intervention opportunities, and identifying expansion opportunities while solidifying value realization. A dedicated customer success function preventing just five churns per month at $10,000 annual contract value saves $600,000 annually—typically far exceeding the cost of retention programs. For optimization strategies across channels, explore data-driven approaches to customer engagement.
How do acquisition costs compare to retention expenses?
Acquiring a new customer costs 5 to 25 times more than retaining an existing one. This disparity becomes particularly problematic when high churn rates force continuous prioritization of expensive acquisition over cost-effective retention. Every churned customer represents not just lost revenue but also the opportunity cost of deploying acquisition resources more efficiently. The financial implications intensify when considering that retained customers typically increase spending over time, while new customers require additional onboarding costs and time to reach full value realization—creating scenarios where companies pay premium prices for customers who may churn before reaching profitability.
Why Choose a MultiCast campaign by Media Strobe?
All MultiCast campaigns are expertly created to answer highly relevant questions about your service/product that your future customers are asking (all over the internet) before they make their purchase decision. Your MultiCast is distributed to hundreds of high authority sites IN THE EXACT WAY that Google and AI love, and in 8 formats so that your answers show up everywhere people are asking questions. The benefits of running a MultiCast campaign are increased visibility (leading to increased ranking), increased warm/hot traffic, reduced customer acquisition costs, predictable growth that can be scaled, generate more revenue with higher net profit, true control over your lead generation, and better return on paid ads.